Introduction
Air Quality Information System Version 2 (ISKO 2) contains a database on air quality.
There are three main types of data in the database:
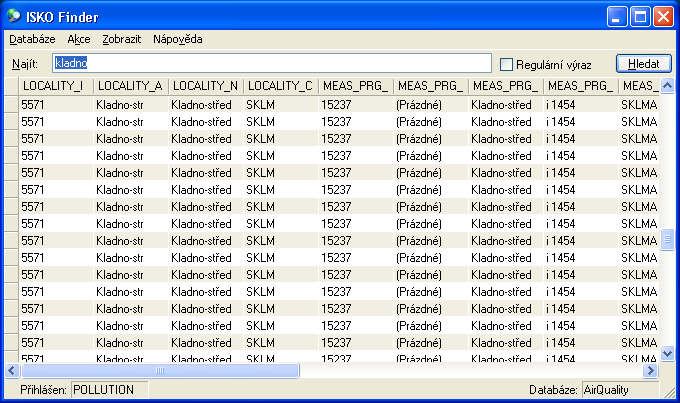
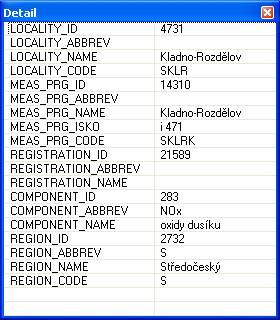
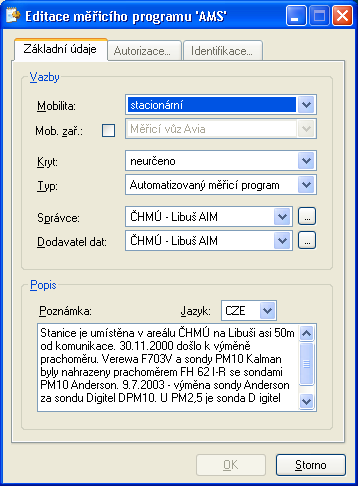
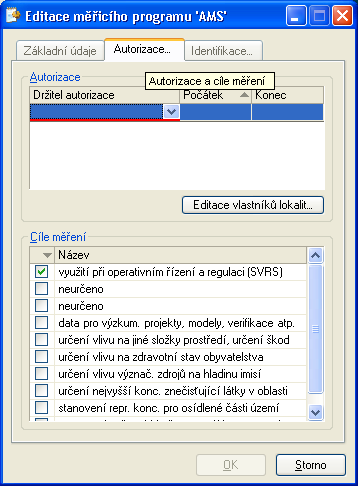
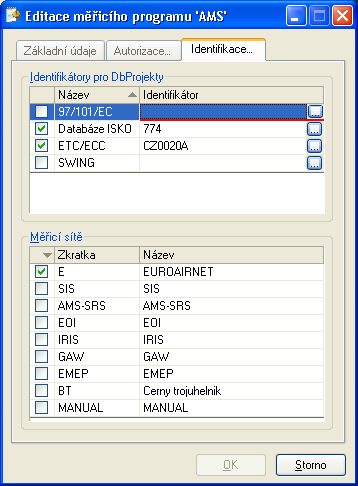
On the one hand, there are descriptive data about regions, locations, measurement networks, stations, measured components and relations between them.
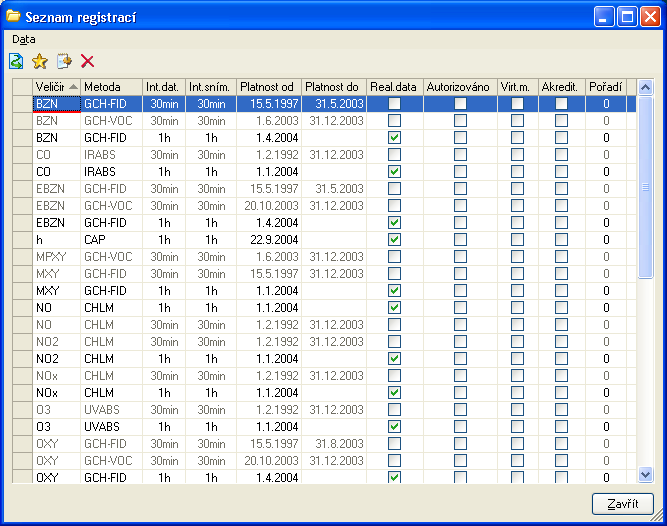
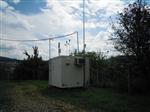
Furthermore, they are the primary measured data. Network of measuring stations of CHMI, Health Institute and other organizations constantly delivers measured air quality data (concentration of harmful substances) and meteorological data.


From primary data, aggregated data is calculated - all averages, quantitations, and other statistical data.
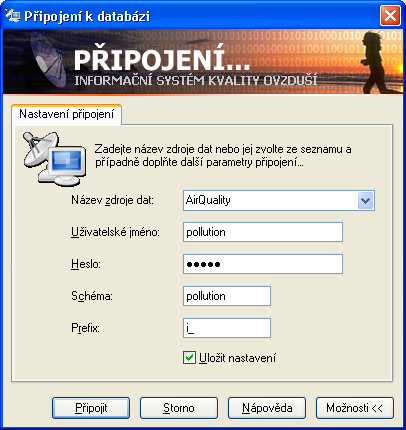
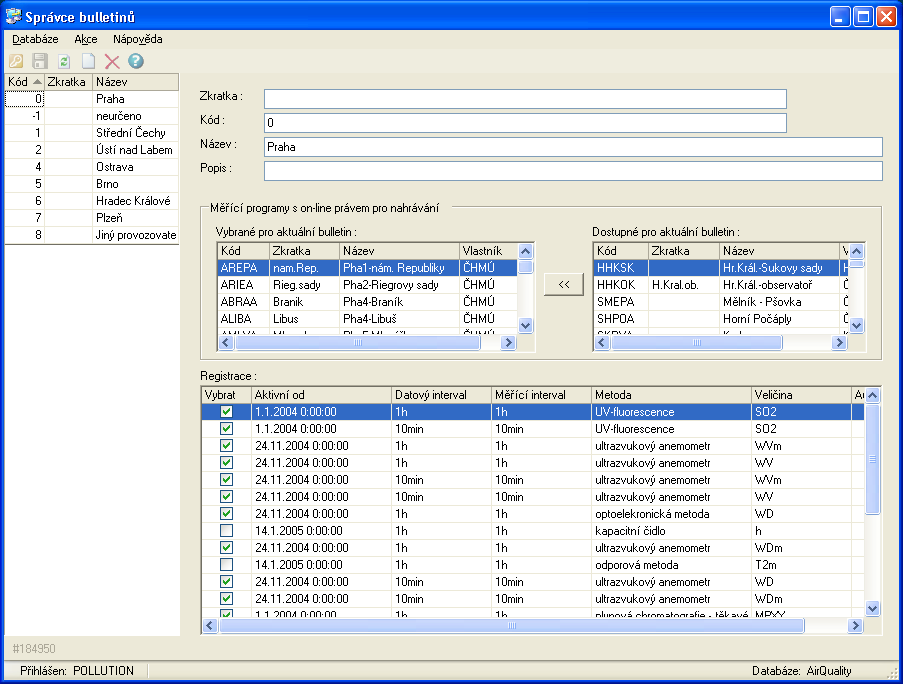
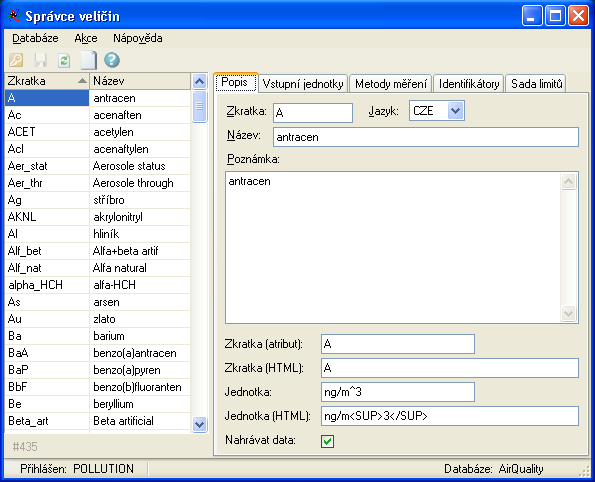
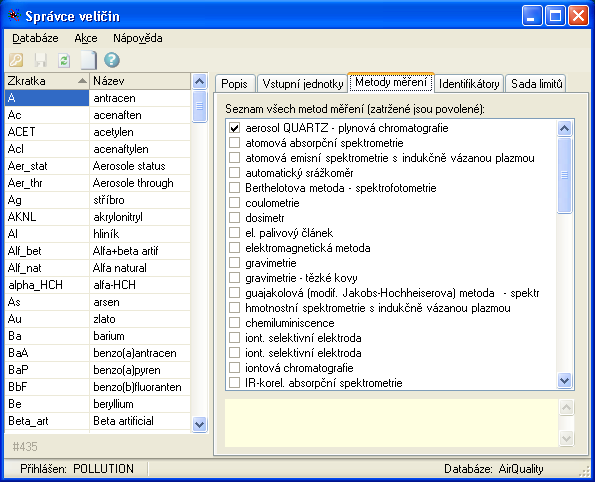
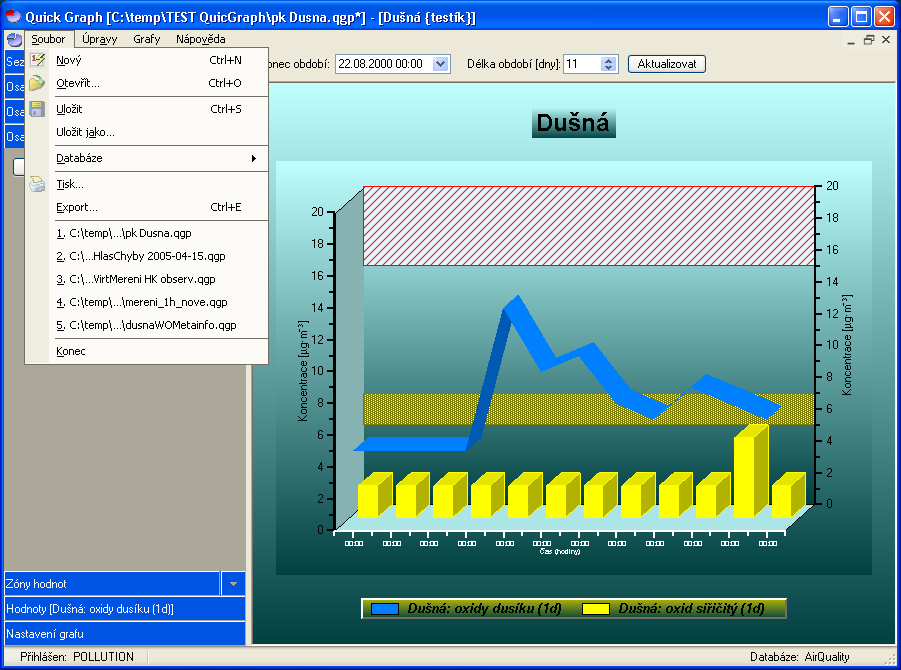
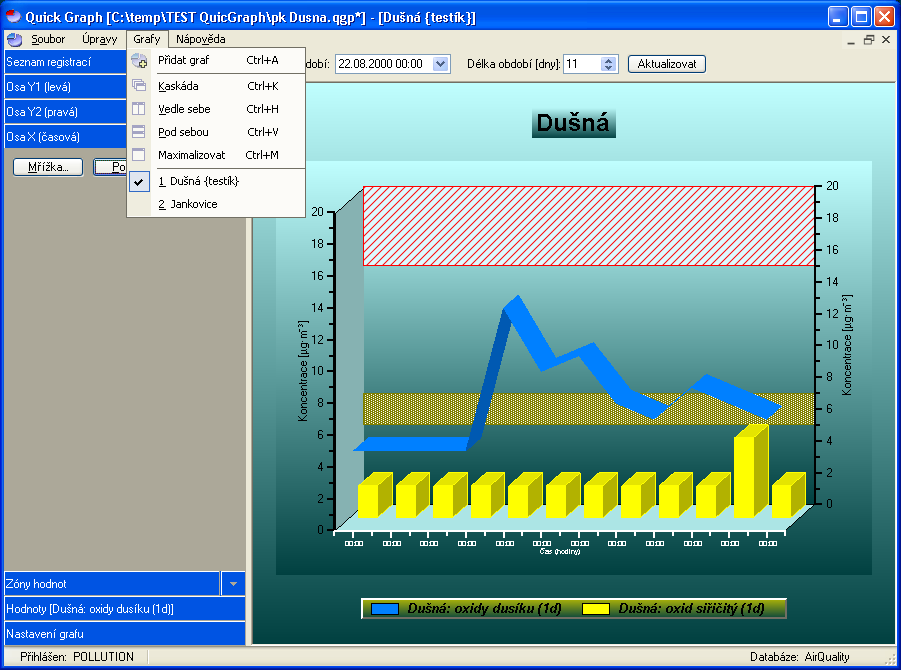
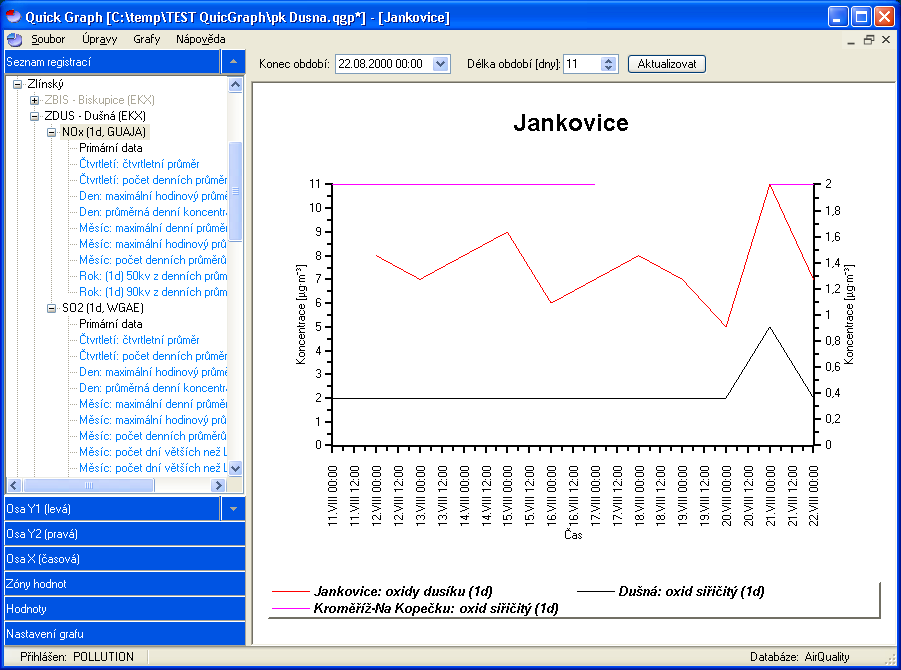
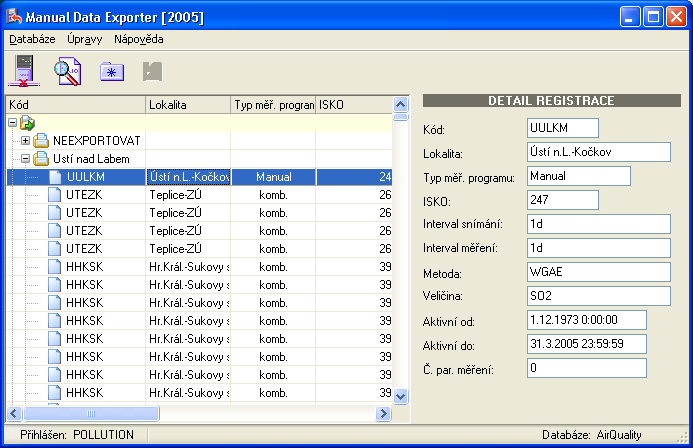
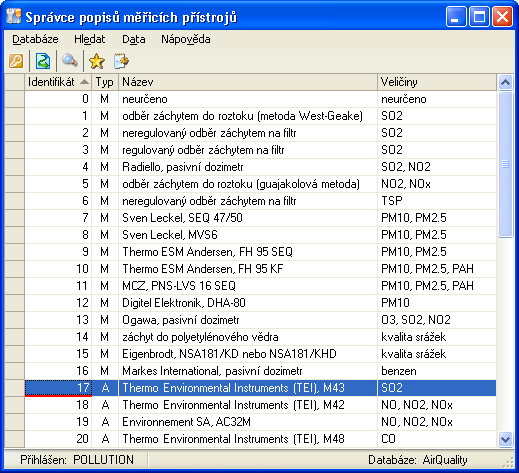
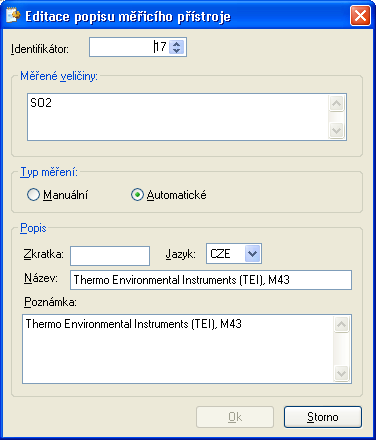
Client applications are used to import, maintain, export data, and then graphically present them. These applications are based on Microsoft .NET framework and run on OS Microsoft Windows.
Portal CHMI
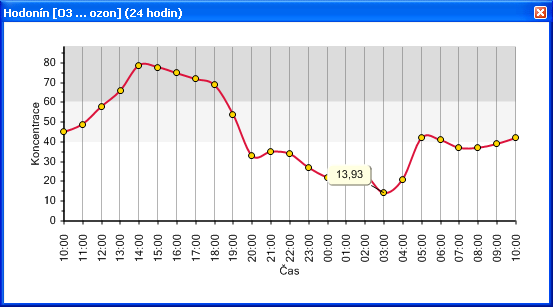
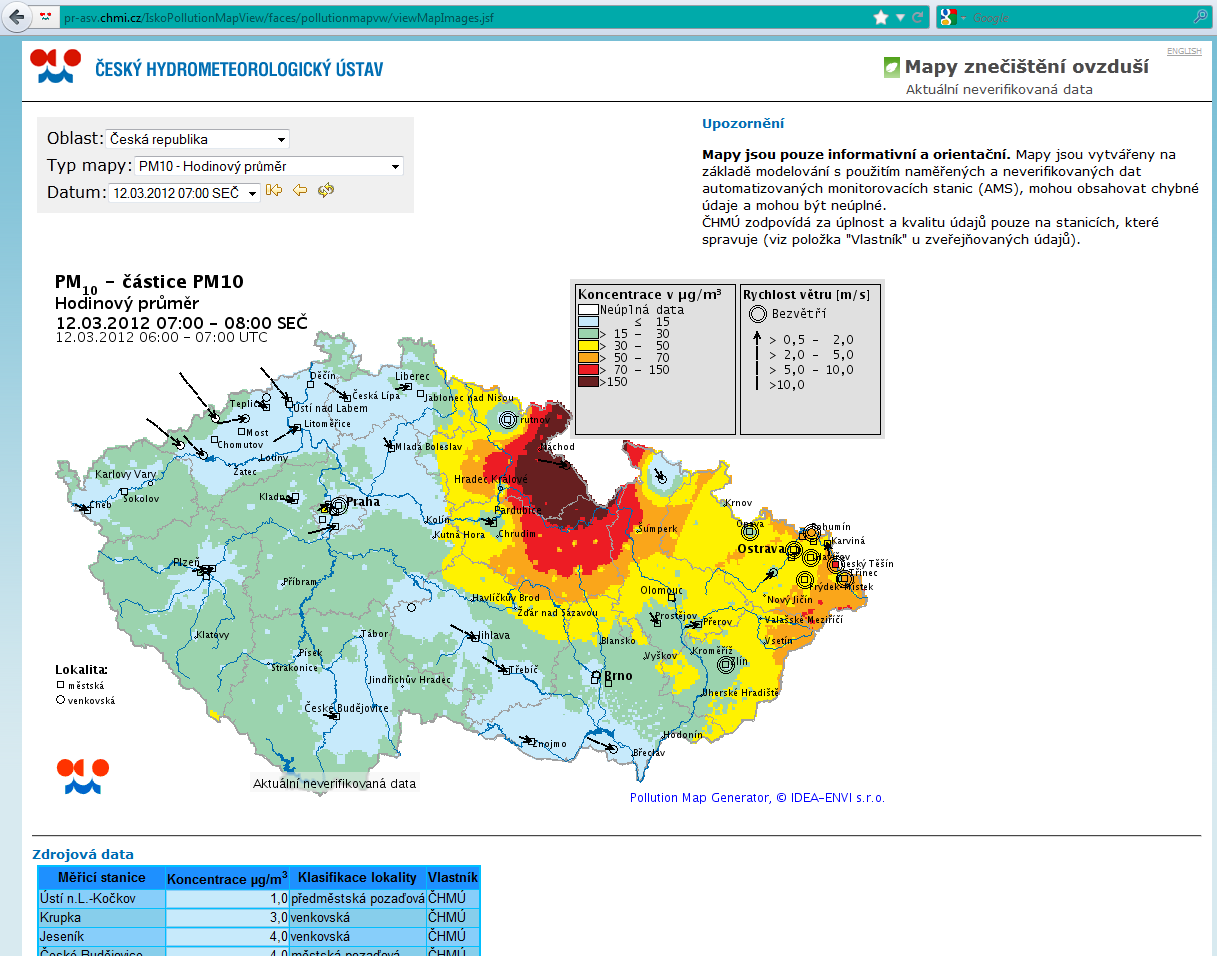
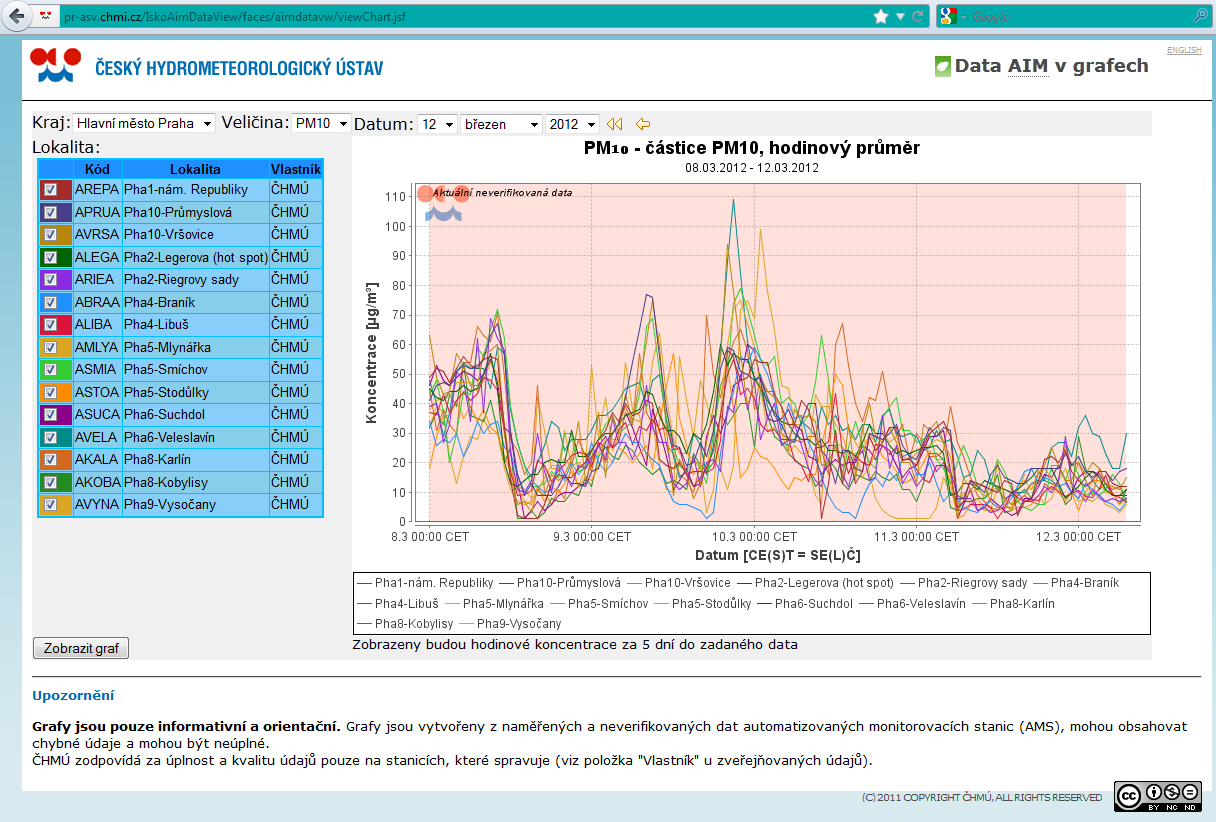
The ISKO2 system provides information on air quality in the form of maps, graphs and table reports on the CHMI portal.
Additionally, large amounts static pages are routinely generated from the ISKO2 system:
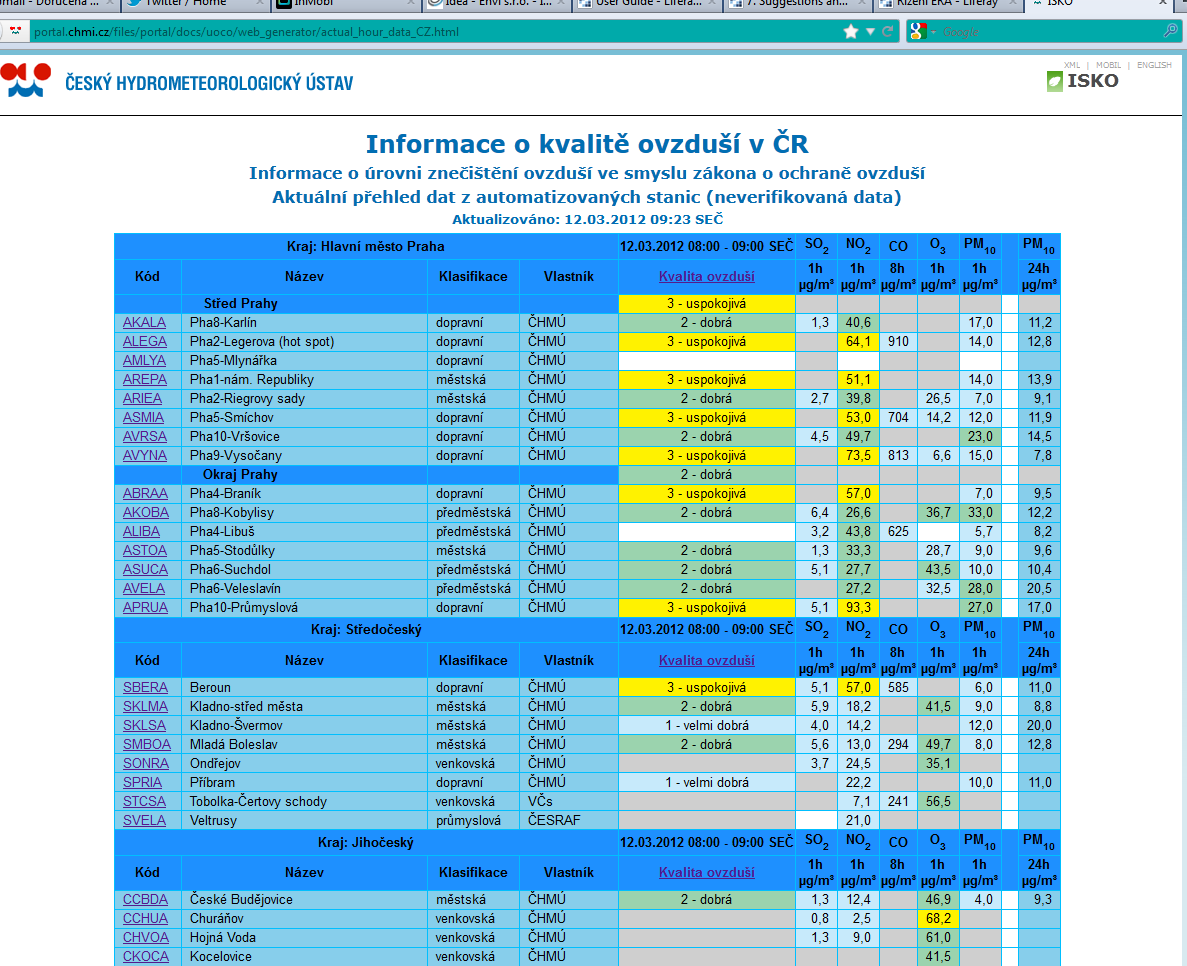
- Current hourly overview
- Immission measurement sites
- Places of precipitation composition
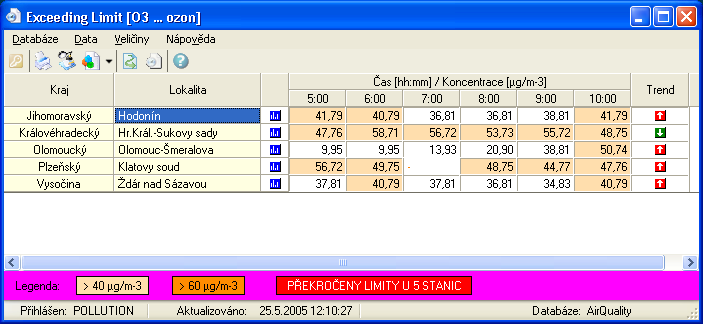
- Exceeding air pollution limits
- Smog warning and control system
- Tabular report of AIM
- Tabular report of MIM
... and many others, accessible only on intranet of CHMI.
Tabular air pollution report
Every year, the CHMI publishes tabelar air pollution report. This report is generated using ISKO 2.
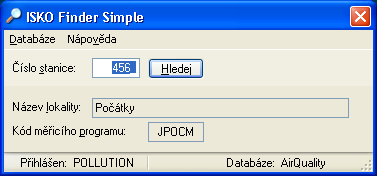
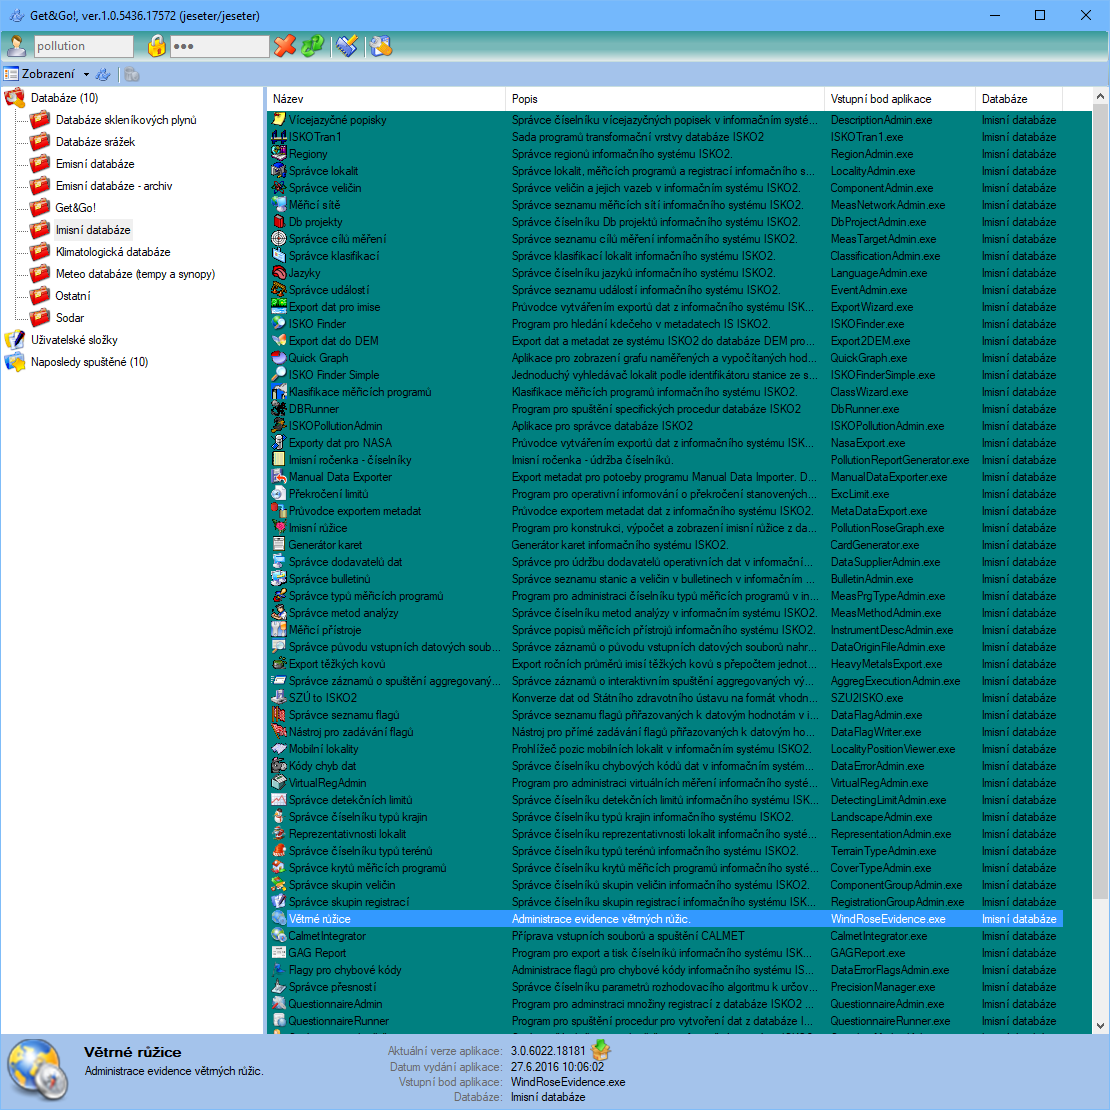
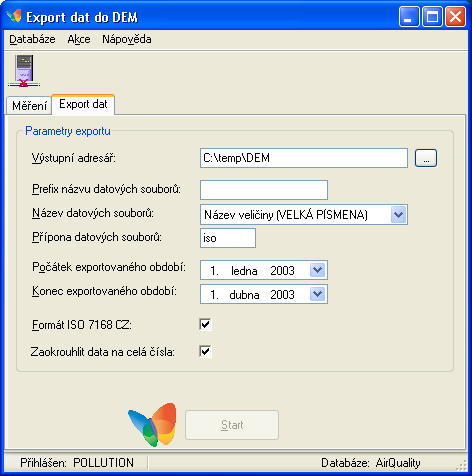
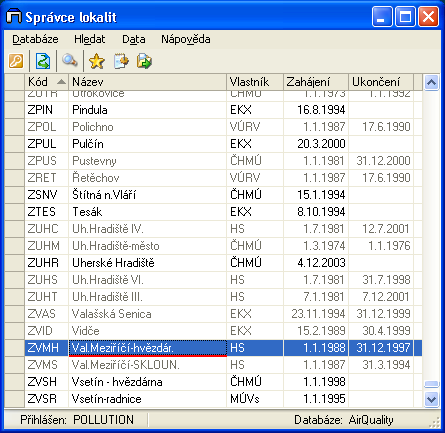
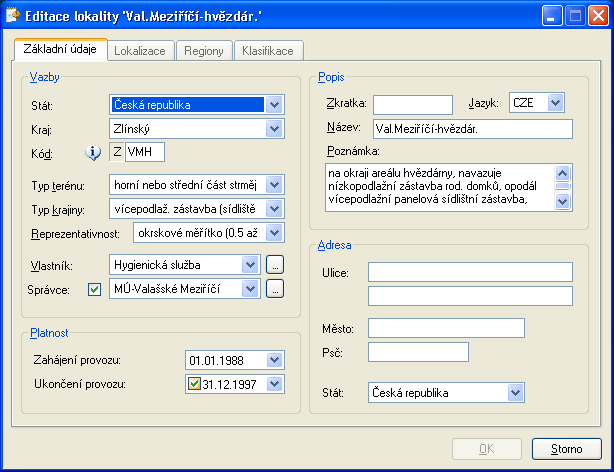
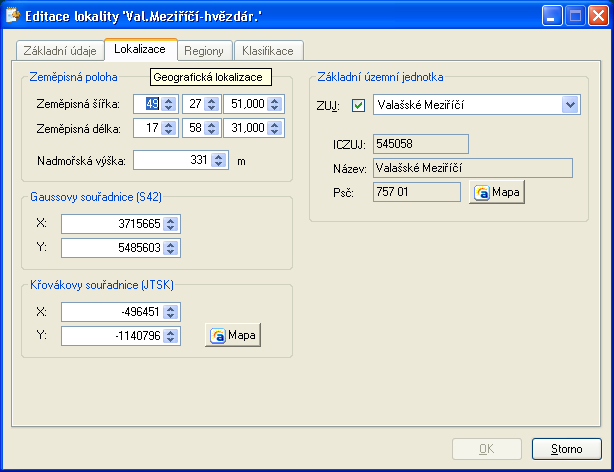
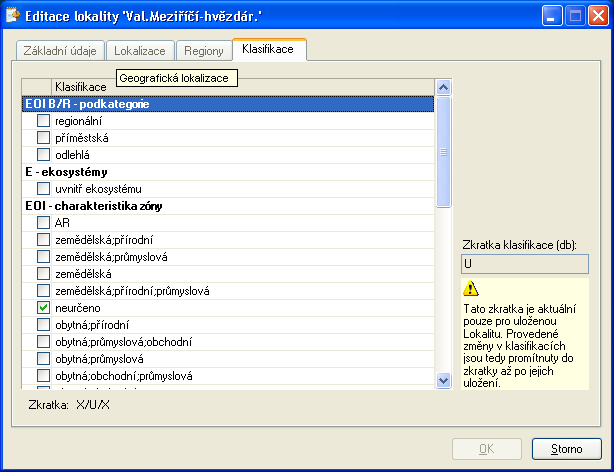
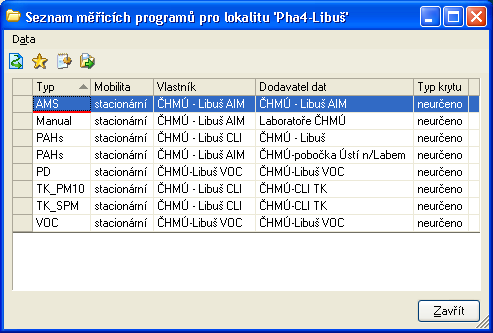
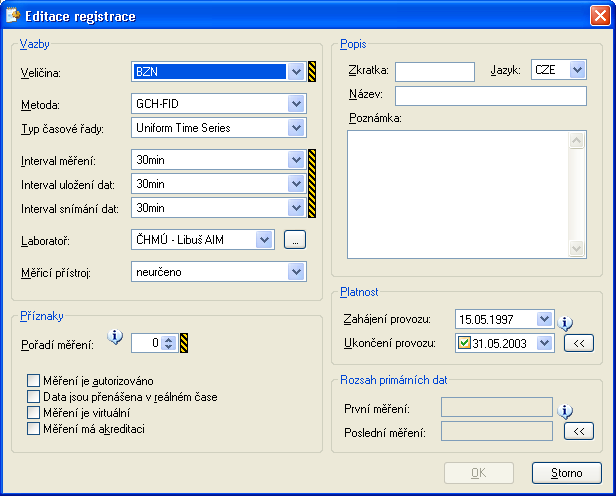
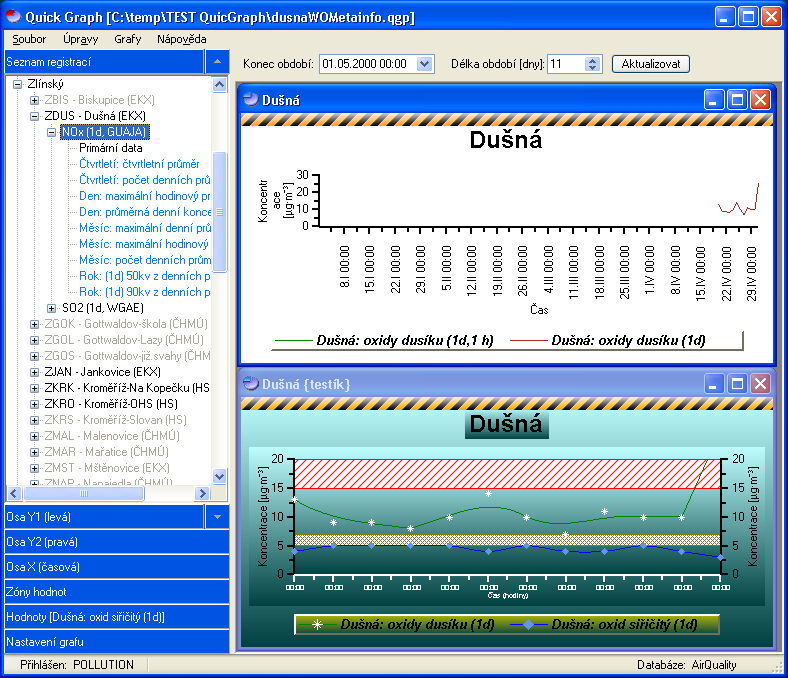
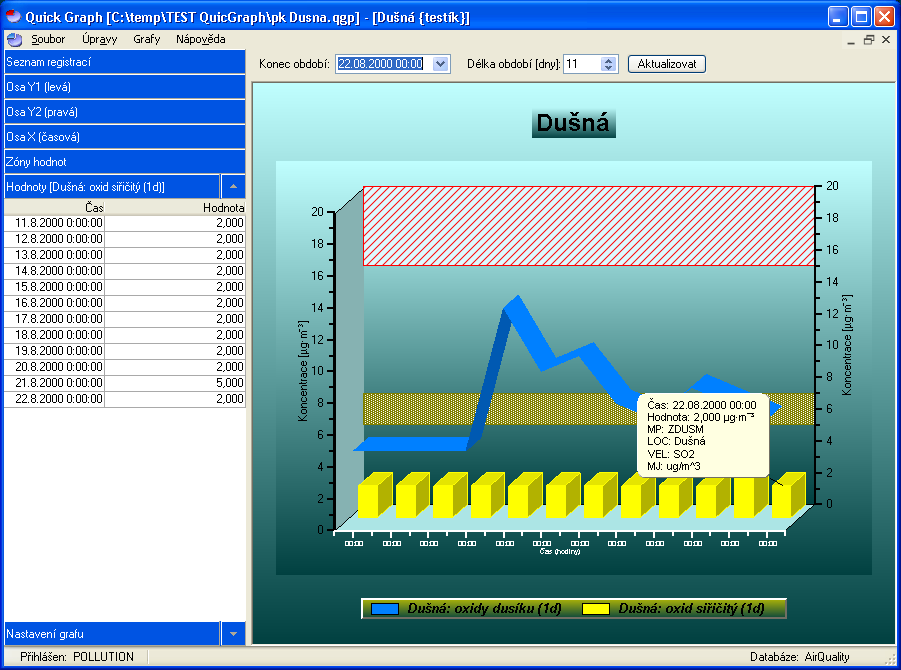
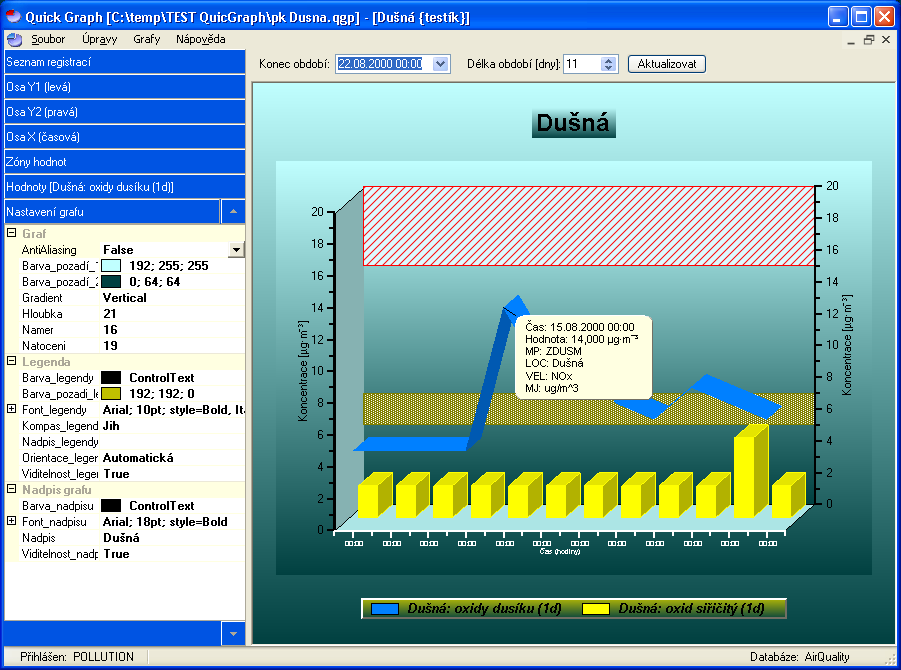
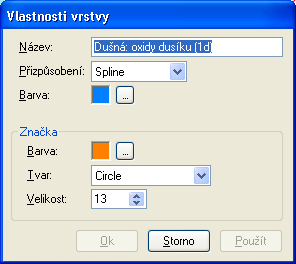
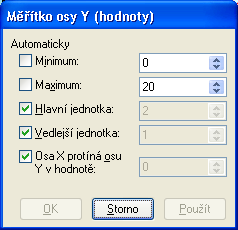
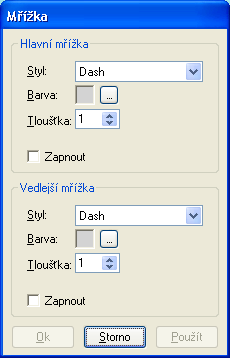
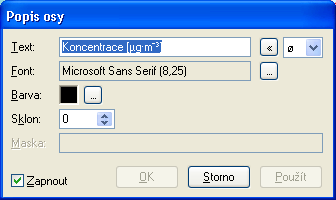
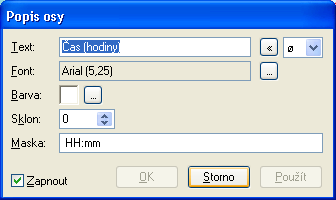
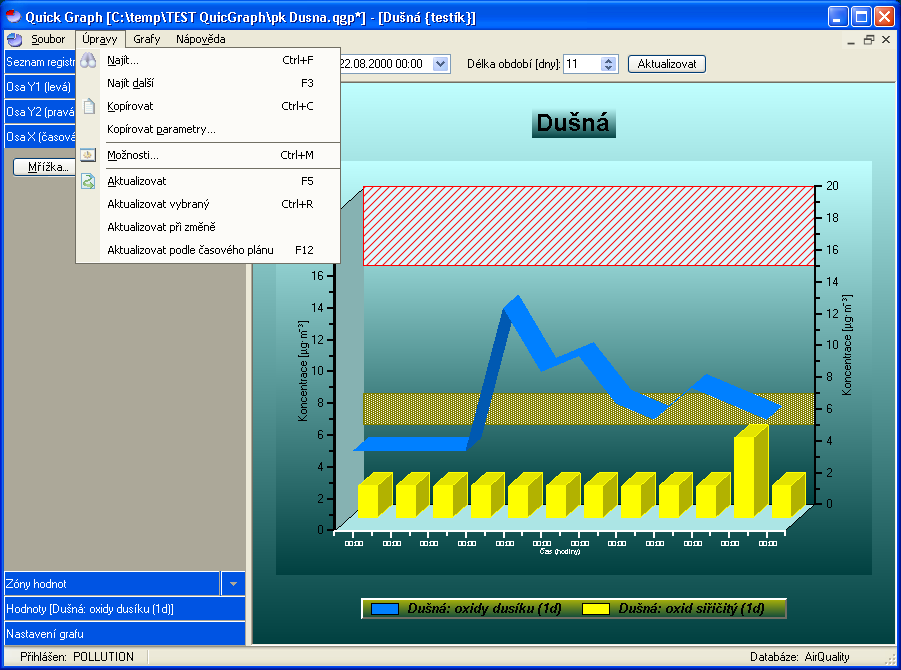
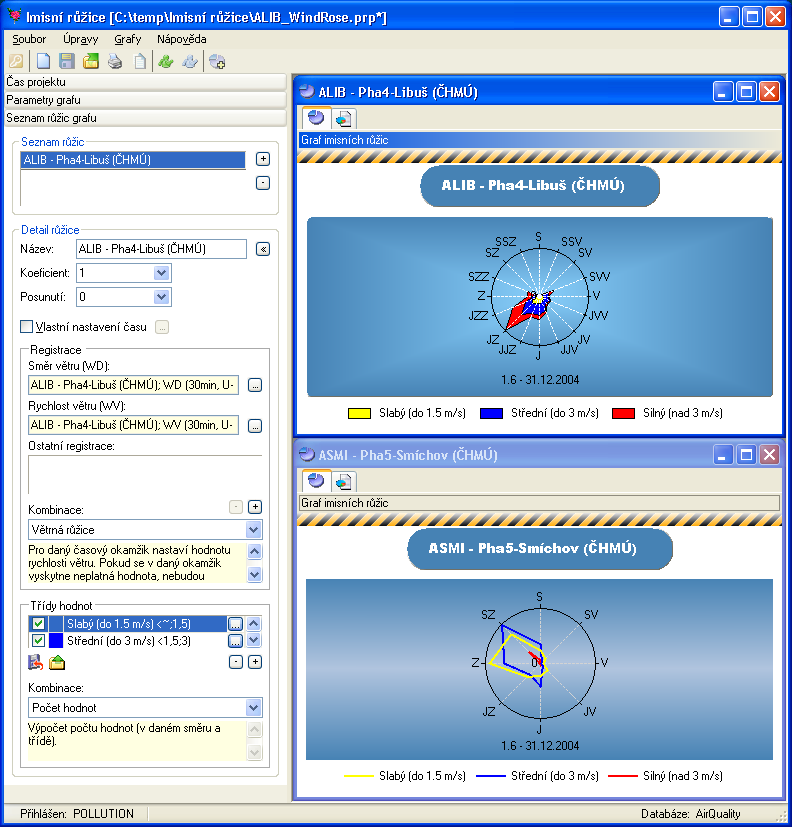
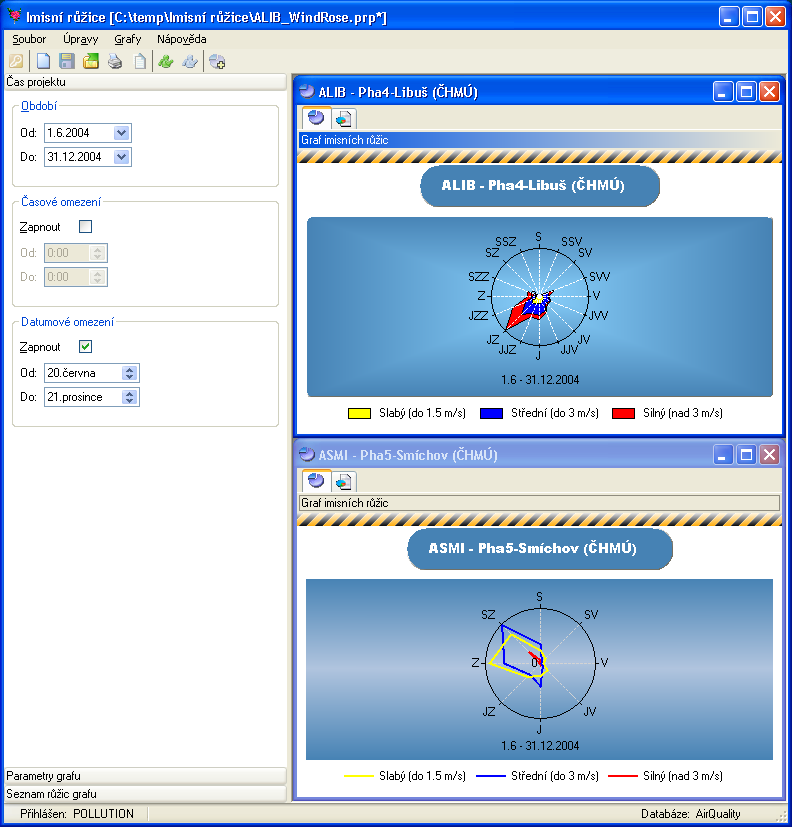
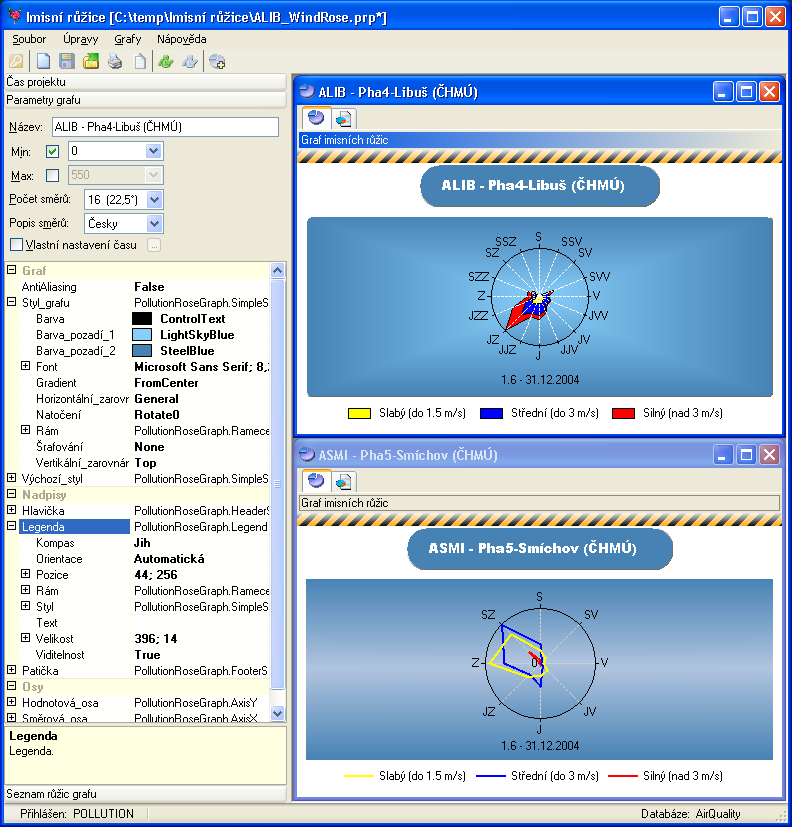
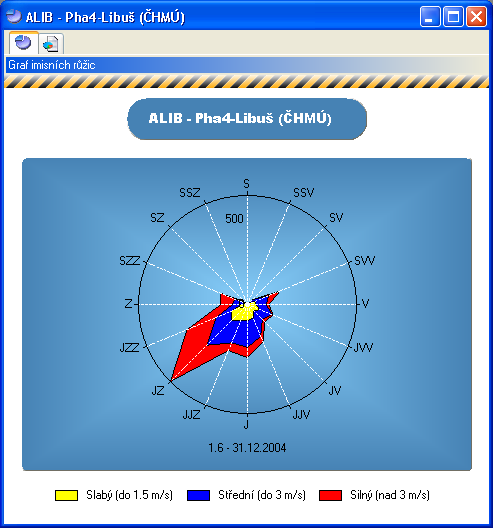
Screenshots gallery - client applications